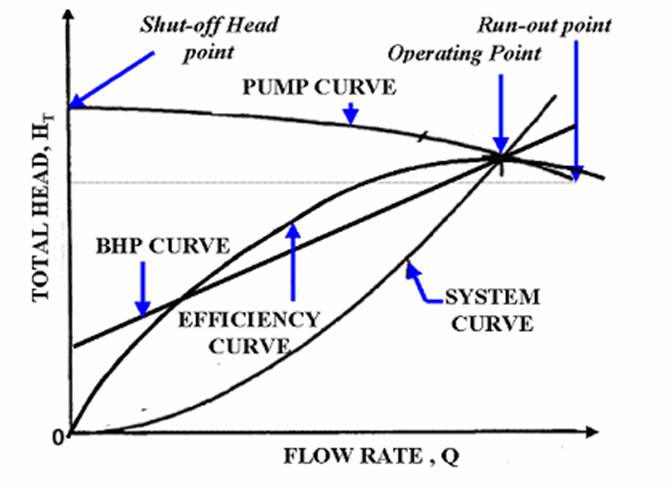
Figure D.01: Typical system and pump performance curves
Understanding Centrifugal Pump Performance Curves
The capacity and pressure needs of any system can be defined with the help of a graph called a system curve. Similarly the capacity vs. pressure variation graph for a particular pump defines its characteristic pump performance curve.
The pump suppliers try to match the system curve supplied by the user with a pump curve that satisfies these needs as closely as possible. A pumping system operates where the pump curve and the system resistance curve intersect. The intersection of the two curves defines the operating point of both pump and process. However, it is impossible for one operating point to meet all desired operating conditions. For example, when the discharge valve is throttled, the system resistance curve shift left and so does the operating point.
Figure
D.01: Typical system and pump performance curves
Developing a System Curve
The system resistance or system head curve is the change in flow with respect to head of the system. It must be developed by the user based upon the conditions of service. These include physical layout, process conditions, and fluid characteristics. It represents the relationship between flow and hydraulic losses in a system in a graphic form and, since friction losses vary as a square of the flow rate, the system curve is parabolic in shape. Hydraulic losses in piping systems are composed of pipe friction losses, valves, elbows and other fittings, entrance and exit losses, and losses from changes in pipe size by enlargement or reduction in diameter.
Developing a Pump Performance Curve
A pump's performance is shown in its characteristics performance curve where its capacity i.e. flow rate is plotted against its developed head. The pump performance curve also shows its efficiency (BEP), required input power (in BHP), NPSHr, speed (in RPM), and other information such as pump size and type, impeller size, etc. This curve is plotted for a constant speed (rpm) and a given impeller diameter (or series of diameters). It is generated by tests performed by the pump manufacturer. Pump curves are based on a specific gravity of 1.0. Other specific gravities must be considered by the user.
Normal Operating Range
A typical performance curve (Figure D.01) is a plot of Total Head vs. Flow rate for a specific impeller diameter. The plot starts at zero flow. The head at this point corresponds to the shut-off head point of the pump. The curve then decreases to a point where the flow is maximum and the head minimum. This point is sometimes called the run-out point. The pump curve is relatively flat and the head decreases gradually as the flow increases. This pattern is common for radial flow pumps. Beyond the run-out point, the pump cannot operate. The pump's range of operation is from the shut-off head point to the run-out point. Trying to run a pump off the right end of the curve will result in pump cavitation and eventually destroy the pump.
In a nutshell, by plotting the system head curve and pump curve together, you can determine:
1. Where the pump will operate on its curve?
2. What changes will occur if the system head curve or the pump performance curve changes?